Top KPIs for your Contact Centre


BOOST PRODUCTIVITY & EFFICIENCY WITH THE RIGHT CONTACT CENTER KPIs
By Rod Jones
© 2019 Rod Jones Consulting (Pty) Ltd
Ver 2.0 at 4 June 2019
Any call centre, contact centre or Cx-enabled customer interaction centre is faced with five powerful challenges in 2019.. and beyond. These are the five most important expectations that the organisation’s most senior executives will demand of the operation.
■ Cut, Reduce or Cap Operational Costs
■ Increase Operational Productivity and Efficiencies
■ Increase Revenues (Including Sales, Retention, Up-Sell/Cross Sell, Collections etc.
■ Reduce Risks (Including financial as well as brand and reputational risks)
■Increase Customer Satisfaction (Including all contemporary Cx measures)

For most well-run contact centres, the focus over the past decade has moved from driving efficiency metrics to striving for positive interaction outcomes.
Resolving customer issues quickly and efficiently is the fundamental principle of any call centre or contact centre. It is precisely what customers demand and expect of our operations. The quicker that agents process high quality customer interactions with positive outcomes, the greater the operational efficiency and productivity. And if this is achieved in conjunction with CX-orientated Quality Assurance practices, there will be an additional positive knock-on effect in terms of Customer Satisfaction as well as positive business outcomes.
Clearly state exactly how your specific operation defines ‘First Contact Resolution’. No two contact centres are alike, and no two interaction types are exactly the same. Just as different interaction types will have different SLAs, it is also vital to clearly define FCR in this context. Ensure that your definitions contain both inclusive and exclusive criteria. For example: Does your operation define ‘Resolved’ as being when the main issue has been dealt with (FCR from the operation’s perspective) and also, only if the customer specifically expresses full and complete satisfaction with the entire interaction?
How do we know that we have achieved FCR? Putting it simply, we need to ask the customer. Well-trained agents (supported by effective QA, coaching, mentoring and on-going training) will conclude calls (or any other interaction type) with a short set of structured probing questions. Ideally, these are scripted or system-driven and will form part of mandatory call control and post-call wrap-up disciplines. Analysis of this data will provide clear indicators of actual FCR; this, subject to correlation with Repeat Contact Analytics.
The second dimension of FCR is the challenge of identifying Repeat Contacts. Repeat contacts relating to previously reported issues mean significantly increased customer effort on the one hand, and this has a consequential negative impact on loyalty and the overall customer experience.
In many cases, identified repeat contacts will highlight flaws in operational processes or even underlying organisational policies and other systemic drivers.
Repeat contacts also consume extremely costly operational resources and are therefore a significant drain on efficiency and productivity. Use the contact centre technologies and reporting capabilities to analyse data to identify repeat calls using CLI numbers (Calling Line Identification). Typically, call or interactions going back seven to ten days might well be related to a single issue. But not always. Correlate this data with the CRM data and craft policies and processes to address identified issues.
Low FCR (and that means anything under about 70% FCR) is a clear indicator that there is room for considerable improvement in the contact centre, and urgent attention is needed to remedy issues that fall into four primary categories. Fix these issues and your true FCR will rise significantly; as will customer satisfaction
Empowerment – Ascertain what percentage of non-FCR compliant calls could agents have effectively handled but were not empowered by the organisation to do so. For example: Policies, processes, procedures or the absence of specific mandates or empowerment may preclude agents from achieving FCR for certain interaction types.
Competency – Identify how many calls or interactions are either not resolved or escalated because all or some specific agents have not received the appropriate training, and are therefore not competent to assist customers with certain types of interactions.
Processes – Identify which interaction types and which processes are responsible for non-FCR compliance. Make adjustments (where appropriate) to policies, procedures and processes.
Systems – Review current technologies in terms of agent support, knowledge management, data harvesting, analytics and reporting. Implement appropriate changes.
A word of caution: Great care must be taken when defining precisely what FCR means in any specific operation. FCR isn’t a “One-Size-Fits-All” KPI. Invest considerable time and effort to craft the exact, measurable definitions specifically for your operation.
Most internationally recognised benchmarking reports and consultants’ views recommend that First Contact Resolution should be between 70% and 75%. However, percentages will most likely change depending on how FCR is defined in the context of SLAs across different channels, by different interaction types or call reasons and by the methods used to measure FCR.
To ensure that management is provided with meaningful reports and actionable insights, it is recommended that the operation defines individual FCR targets for the top ten to fifteen interaction types and contact reasons, across all available interaction channels.
By focussing attention and making rational investments into achieving ever-improving FCR statistics, the operation will benefit significantly. Here are five ways that the organisation will benefit.
Reduced Operational Costs. Achieving high (75%+) FCR will have a dramatic impact on the reduction of repeat calls. This will not only significantly improve overall operational efficiency, effectiveness and cost containment but it will also go a long way to reduce agent stress levels when interaction volumes spike. A 15% increase in FCR can result in between 50% and 60% reduction in repeat calls.
Improved Customer Satisfaction. FCR is one of the key factors in the overall Customer Experience (Cx). Improved FCR has a direct and positive impact on the operation’s Customer Satisfaction Index (CSat)
Increased Revenues. When customer issues are resolved quickly and efficiently on the first contact, it immediately opens up the opportunity for agents to up-sell or cross-sell products or services.
Increased Customer Loyalty. When customer issues or concerns are resolved quickly on the first contact, customers feel valued and appreciated. High FCR means significantly increased long-term customer loyalty and consequentially, increased Customer Lifetime Value (CLV)
Improved Employee Engagement. By implementing process, technology and systemic changes to drive improved FCR, overall agent engagement and job satisfaction will improve significantly. By specifically categorising certain types of FCR that are within the agents’ ability to control, well-structured incentives and bonuses can drive significantly improved performance, longer tenure, reduced attrition and reduced absenteeism.
Quality: A degree of excellence as measured against similar things
Assurance: Confidence or Certainty
It means being confident or certain that your call center is achieving excellence.
There is no shortage of information supporting the principle that implementing and maintaining robust quality assurance policies, procedures and processes is vital to the well-being of any contact centre or Cx operation.
When crafting such protocols, it is vital that the two primary dimensions of QA are kept in balance: The issues that are important and matter most to Customers. The issues that matter most to the business; these will include compliance and governance.
It is a misconception that contact centre QA is merely a matter of developing or evolving a multi-faceted ‘tick sheet’, perhaps applying a few weightings and after that, it’s all plain sailing. By not recognising the distinctions and the importance of three very different strategic approaches to QA, managers are not only missing the point, but also missing out on the opportunity to use QA to feed the organisation with extremely valuable business intelligence; the very actionable insights that are necessary to achieve defined business outcomes.
The three dimensions of QA are: Operational, Tactical and Strategic. Each of these, by their nature, will have uniquely different sets of KPIs or measurables and therefore, very different assessment criteria and weightings. This principle therefore requires that the operation crafts at least three distinctly different call assessment checklists and that assessments are carried out with the view to arriving at specific business insights in each of these areas.
It is vital that the operation constantly monitors agent performance against the established baselines or benchmarks in the context of the three dimensions mentioned above. Thereafter, this data can be used for analytics, coaching, mentoring and training on an on-going basis; a closed loop process. This to ensure that the contact centre is firmly kept on the path of continuous improvement.
Opinions vary greatly about how many agent calls or interactions should be assessed in any given period, At the one end of the spectrum, there are reasonably successful operations assessing fewer than one agent call or interaction per week, whilst others are assessing as many as 10 to 12 calls per agent per week, or as high as 50 per month. The figure of 8 to 10 calls per agent, per month appears to be as close as we can possibly get to what may be called ‘global best practice’.
It must be noted, however, that the widely accepted practice of ‘random call selection’; for the purposes of assessments, more than likely assesses mostly ‘Average’ calls.
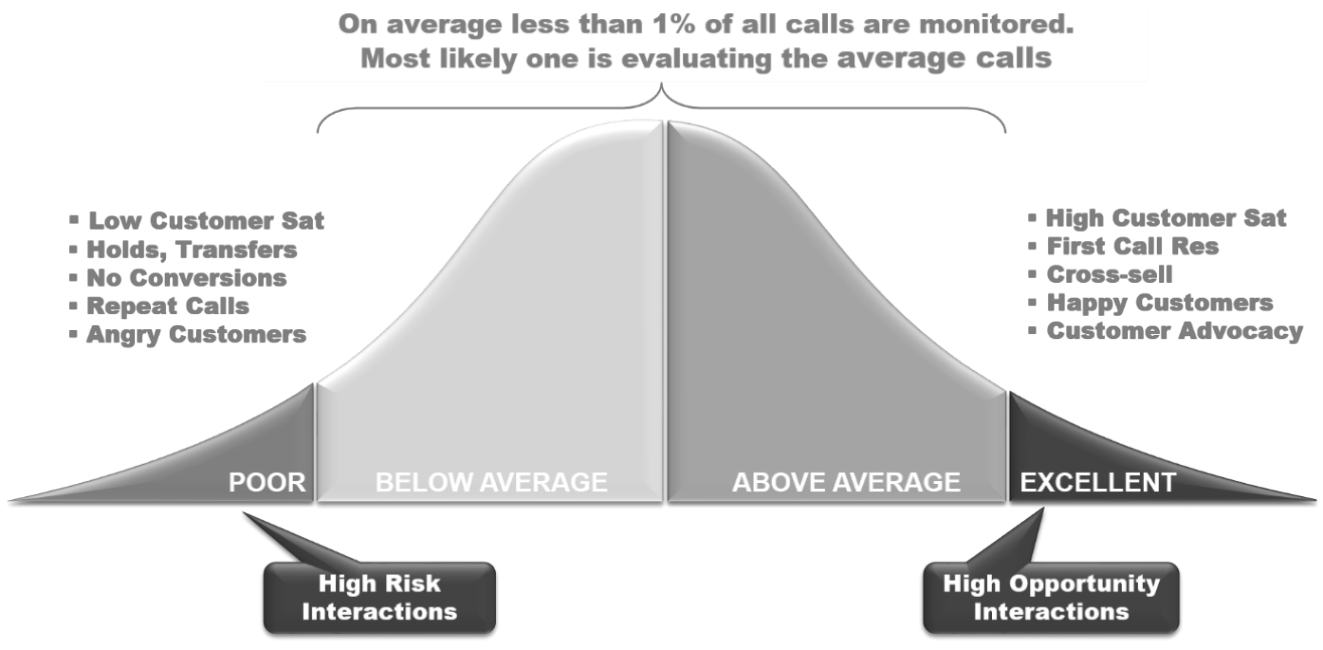
Statistically, out of the typical 8 calls per agent, per month, only one is likely to be a ‘good’ or High Opportunity call, and two calls will be ‘poor’ or High-Risk calls. The other six calls will be spread fairly evenly as ‘Average Calls’ that provide little or no real business value.
Contact centre operators are advised to implement technology-enabled interaction identification and selection solutions utilising data analytics, ‘word spotting’ and other automated QA techniques.
Given that contact centre QA has become one of the core drivers for improving Customer Experience, Business Performance and contact centre Operational Efficiencies, there is a fast-growing trend for operations to outsource all or a portion of their QA to specialist third party service providers.
Historically, typical contact centre QA has consisted of basic checklists comprising of many Do’s and Don’ts, with significant ambiguity and mystery around the scoring and reporting, and comparatively little value being added to the organisation at a strategic level. At worst, QA is viewed in the contact centre as a form of ‘discipline’ – ‘Big Brother is Watching’.
In today’s world of customer-centric organisations and Cx-enabled contact centres, there are many benefits to outsourcing QA. These include:
Cost Effective. In most cases, it is significantly more cost-effective to outsource the QA function to a specialist third party provider. Measurable cost savings are significant. In many instances outsourced QA will be as low as 40% of internally managed QA.
Specialised QA Tools. Most reputable outsource quality experts have highly advanced, specialised QA and on-line assessment and coaching tools that allow managers or supervisors to see results and findings immediately and in real time.
Error Detection. Good QA service providers also assess operational front-line data entry and use of CRM systems, and if desired can correct or ‘flag’ areas identified as “risk/incorrect”
Drive Business Improvement. Specialists QA service providers are able to drive business improvements by assessing First Call Resolution problems, new opportunities, potential risk of sales ‘stickability’ and propensity to pay (PtP) for collections environments. Experienced interpretation of these type of findings provide valuable business insights and business intelligence to the organisation.
Near Real-Time. Certain professional QA service providers can deliver almost ‘real time’ assessments, reports and coaching or training recommendations.
Impartiality. Independent, objective assessments and feedback is essential when linking QA findings with incentives/KPI’s.
Multilingual. Specialist QA service providers can assess calls in accordance with customer demographics and in line with TCF (Treating Customers Fairly principles)
Best Practice Knowledge & Guidance. Experts in QA services will guide your organisation to implement ‘Best Practice’ both locally as well as internationally. This can include consulting services as well as specialised training for managers, team leaders and other key operational support staff.
On-Line Coaching. Specialist QA services can provide the ability for agents to log into the quality and online coaching tool to identify first hand their results and personal development opportunities.
Flexibility. The operation can scale up or down QA requirements as required for strategic, tactical or operational purposes
Reduce Headcount. Reduction in fixed HR overheads frees up operational capacity (Contact centre seats) for increased customer service or sales production.
Business Intelligence. Assessment analytics and experienced interpretation and expertise generates reliable and credible insights for decision-making.
Compliance Monitoring. Specialist resources to monitor and report on governance, regulatory and compliance issues.
It will be appreciated that implementing and sustaining professional quality assurance processes and protocols in any customer-centric contact centre, is not only vital to the overall performance and success of the operation, but it should also be the source of vital Business Intelligence and Business Insights necessary to drive certain boardroom strategies and tactics.
The following are merely a few of the many benefits that the operation will derive.
Cut Costs and Increase Profits. When designed to focus on all key areas of the contact centre operations (not merely assessing call recordings), QA analysis and feedback will highlight numerous opportunities for cost reduction and revenue improvements.
Driving improved FCR, for example, will significantly reduce repeat call or interactions, a major contributor to contact centre infrastructure and operational costs. Similarly, increased agent satisfaction and engagement will drive longer tenure, reduced attrition and absenteeism as well as reduced recruitment and training costs.
Achieve Consistent Service Delivery. Today’s customer is becoming fully immersed in the day-to-day utilisation of omnichannel interactions with providers. The total customer experience, across all touchpoints – the Customer Journey – has become the focus of most ‘world class’ organisations.
As Dan Kiely of Voxpro so eloquently puts it, “The customer journey is only as delightful as its least delightful experience.”
A robust QA strategy, framework and methodologies will highlight flaws and weaknesses in the service delivery chain and provide the organisation with the necessary insights to remedy these quickly and effectively.
Measure Progress. Scorecards and checklists appropriate to the Operational, Tactical and Strategic goals and standards of the operation will allow management to effectively monitor and manage the continuous improvement of processes, individuals, teams and other defined and measurable business outcomes.
Traditionally, the term ‘Service Level’ refers to the percentage of calls or interaction that are answered within a specified time. For example: 90/20 or 90% of calls answered within 20 seconds. A ‘generic’ service level benchmark such as this is a good indicator of actual operational capacity in terms of technology, infrastructure and manpower
Managers (particularly those managing modern multi-channel or omnichannel operations) should carefully re-define ‘Service Level’ contextual to each of the different types of interactions in their centre, and also in terms of high traffic and off-peak times.
When defining Service Level, cognizance should also be taken of actual customer expectations in the context of the type of operation. For example, an emergency services contact centre will have an significantly higher service level requirement – say 95/5. (95% of all calls answered within 5 seconds) whereas in other circumstances, certain types of customers, such as those calling technical support centres, will be happy with 90/30.
Secondary Service Levels. A problem with a typical 90/20 Service Level is that it doesn’t consider the 20% of callers that aren’t answered within the defined threshold. A good way to ensure that callers aren’t subjected to inordinately long wait times is for each Primary Service Level (PSL), set a Secondary Service Level (SSL). For example: Set 80/20 as the PSL and 99/300 as the SSL. This means that only 1% of calls will be waiting longer than 5 minutes.
Establishing, monitoring and managing the most appropriate KPI for Service Levels will be vital for driving customer satisfaction, operational efficiencies whilst addressing cost management.
Queue Times and Impact on Customer Satisfaction. Most analysts agree that whilst it is important for operations to maintain their individually defined service levels, when service levels drop to below 60%, customer satisfaction starts decreasing significantly even when FCR is achieved.
The following are regarded to be ‘SLA Best Practice Guidelines’ of contact centres aspiring to be regarded as ‘World Class’
Telephone – 90% of calls answered by a ‘Live’ agent within 20 seconds
Email – 95% of emails answered within four hours (the better contact centres are aiming to respond to 80% of emails within 15 minutes)
Live Chat – 80% of chats answered within 30 seconds
Social Media – 80% of contacts answered within 20 minutes. (Some centres are attempting to service social media interactions as close as possible to real-time)
SMS/Messaging Apps – 80% of messages responded to within 40 seconds
Letters – 95% of letters answered within three days
By closely monitoring and analysing Abandoned Rate, contact centre managers will be able to glean valuable insights relating to efficiencies, effectiveness and specifically, into many of the drivers of Customer Satisfaction.
Lost Calls. There are three basic situations where inbound calls can be ‘Lost’ and each of these needs careful consideration.
Abandoned Calls. This is discussed in considerable detail in the text below.
Missed Calls. In some circumstances it is either the ACD’s default setting or it has been adjusted, to automatically disconnect callers once a specific on-hold threshold or wait time has been reached. Astute managers will investigate this setting and make appropriate adjustments.
Dropped Calls. Dropped calls are when calls are accidently disconnected due to technical errors. This metric should be closely monitored and if dropped calls rise above about 0.5% there will be cause for serious concern and remedial action.
The definition of Abandon Rate has caused a great deal of confusion in the industry for many years. The big question is: “At what point does one start measuring Abandon Rate?”. Some operators record and report on the total number of calls that abandon before being answered by a live agent. Others, disregard all calls of under – for example – 5 or 10 seconds. It is also important to check what the ACD default is for reporting AR. Different vendors often have different definitions.
Most consultants will agree that an average abandon rate of between 3% and 4% is acceptable in the majority of inbound contact centres. That is, it is subject to excluding particularly short calls of under 10 seconds.
in typical inbound sales environments, an AR of anything over 1.5% to 2% is cause for serious concern. In most inbound customer service contact centres, an AR of 4% or under is regarded as acceptable.
The value of closely monitoring and analysing AR cannot be underestimated. It is a especially clear indicator of real customer sentiments and there is a close correlation with critical KPIs and factors such as Customer Satisfaction, Customer Loyalty and Customer Lifetime Value.
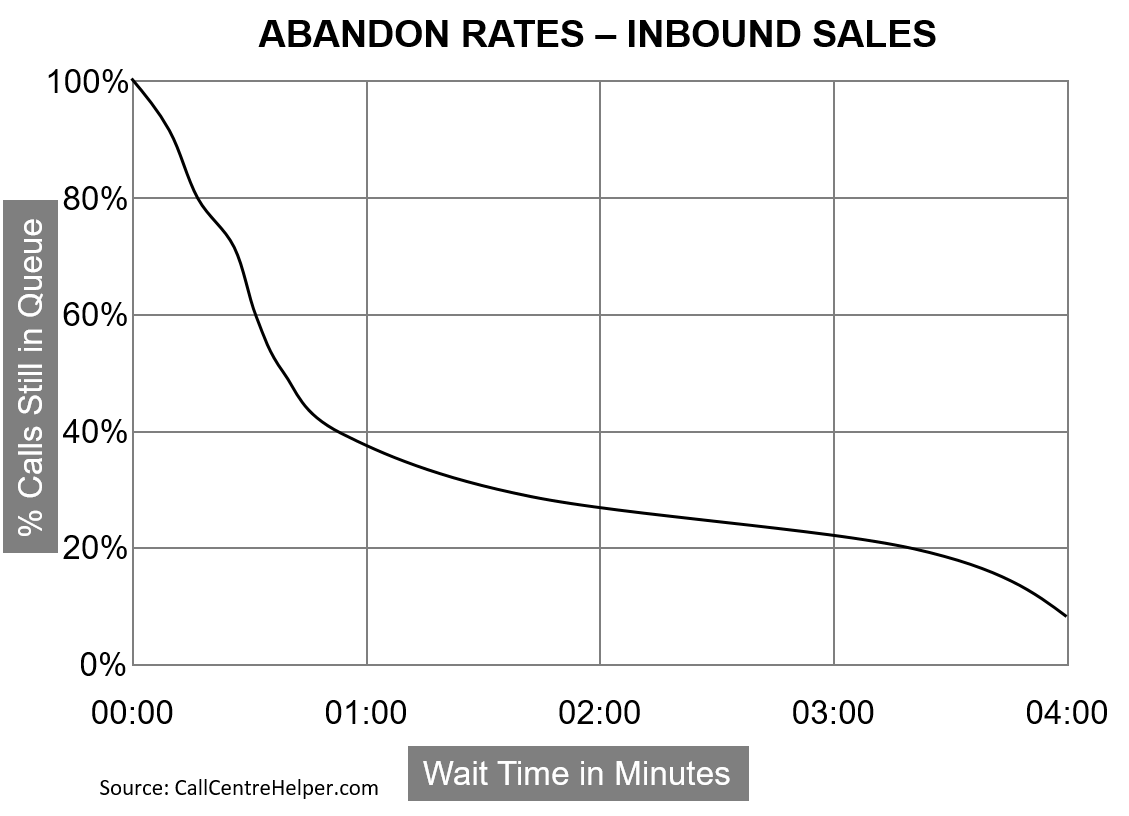
The first insight that AR gives us is an indication of customer tolerances. In certain environments where customers have a multitude of options (such as ordering fast-food or certain inbound sales operations), tolerance levels will be particularly low. But in cases of calls to technical support desks where customers may have little option but to stay on hold, customers may well be considerably more tolerant, and as such, AR will be lower.
The table below clearly shows an example whereby as high as 60% of inbound calls were abandoned in under 60 seconds and over 80% when the hold time reached 4 minutes. It is a startling reality that it is a high probability that most calls abandoned in this scenario probably resulted in a lost sale and therefor lost revenues and lost profits.
Now compare Abandoned Rate of typical inbound Technical Support contact centre.
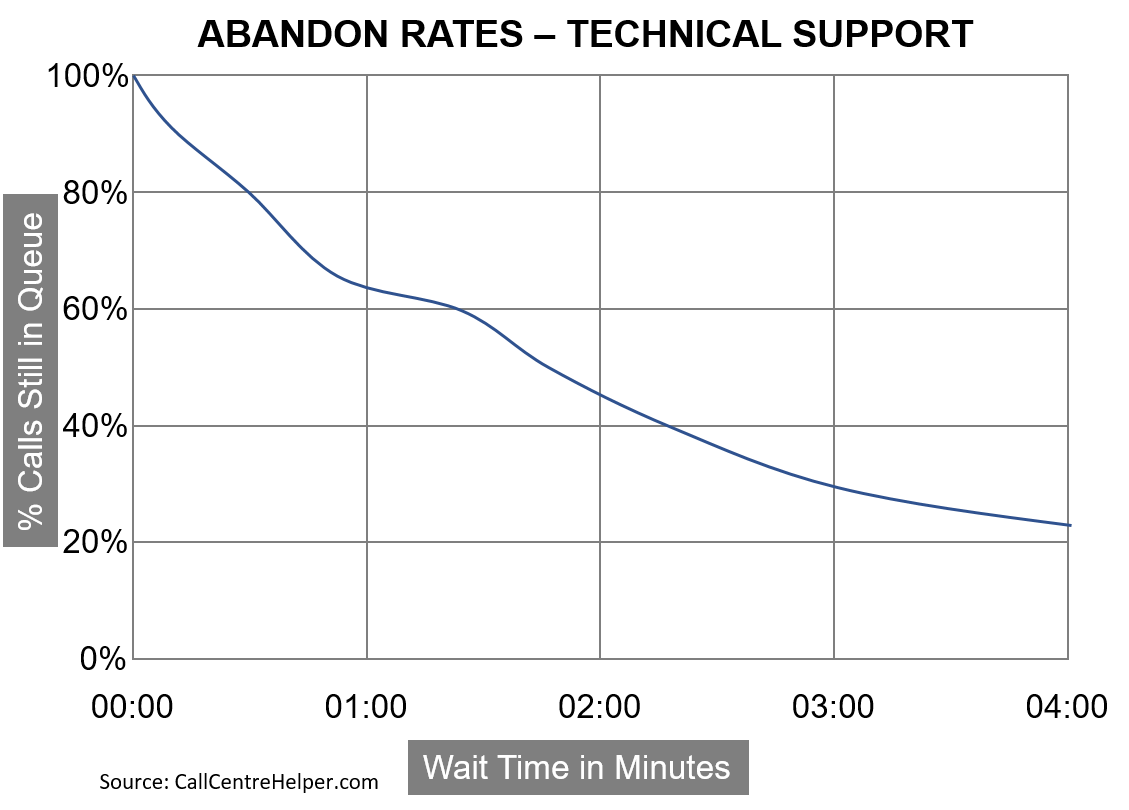
What is clearly notable in this scenario is that Abandon Rate only reaches 50% after approximately 2 minutes and that these types of customers are considerably more tolerant.

Without going into too much detail, there is considerable well-researched evidence to show that as a rule-of-thumb, as long as the calling customer’s issue is resolved quickly and efficiently (i.e. High FCR), even slightly lengthy hold times of up to 45 seconds, can result in relatively high CSat (Customer Satisfaction) scores. Conversely, when the initial hold time (or wait time) is longer than 90 seconds, CSat diminishes greatly, even if the caller’s issue is resolved.
To be in a position to implement meaningful interventions it is vital that representative historical data relating to AR is analysed to establish norms and patterns. This data will provide valuable insights and a baseline for measuring the impact of any operational improvements.
Increase Capacity. Most obvious intervention to improve Service Level and decrease AR is by increasing contact centre capacity by adding more agents. Perhaps by forcing down Average Handling time it may also have the effect of increasing capacity. Whilst these may be ‘Quick Fix’ solutions, they will probably be expensive options and may have very little positive measurable effect on Customer Satisfaction. In fact, forcing down AHT may well have a serious negative impact on CSat.
Redesign the IVR. A thorough investigation into the structure and content of the IVR system may well provide a number of valuable insights and solutions to improve both AR and CSat and the overall customer experience.
IVR First Message. If the analysis of AR data clearly shows that a high percentage of abandoned calls take place within seconds of calls being answered by the IVR, perhaps the content and the style of the initial IVR messaging needs attention.
IVR Menu Structure. Long, complex IVR menus and ‘unenthusiastic’ voice recordings are a guaranteed way to annoy callers and to drive up AR.
Use ‘Intelligent’ IVR Messaging. Most modern ACD’s will allow for the use of intelligent alternative messaging. Instead of merely repeating the typical phrase “Your call is important to us, please hold the line” every 20- or 30-seconds ad nauseum, try ‘escalating’ alternative messages. For example, the second message (after, say, 45 seconds) may be “We apologise for the extended delay. An agent will take your call shortly”. It is also well worth experimenting with different time spacing between on-hold messages. In some environments 20 or 30 second intervals may be appropriate whilst other types of callers would only expect an on-hold message every 45 seconds.
Implement Automated Call-Backs. Many of the more sophisticated contact centre platforms provide the facility to offer callers a call-back option, either as a primary IVR option, or after a certain ‘on hold time’ threshold has been reached. Using CLI (Calling Line Identification) some platforms will be able to identify and differentiate calls from mobile phone calls landlines. It is only practical to offer call-backs to mobile phone callers. Landline callers can be offered a typical message mailbox option.
The Impact of Music on hold. The inappropriate selection of the music that callers are compelled to listen to whilst on hold can have a significant impact on abandon rates as well as on Customer satisfaction. Customer demographics will also be a major influencer. Best practice will be to carry out regular customer surveys, not only probing for attitudes to on-hold music, but to the overall IVR experience.
Monitoring and managing ASA in conjunction with Abandon Rate is often a critical part of certain contact centre’s SLAs, particularly those operating in the BPO environment. It is also important to recognise that like many KPIs, ASA should be defined specifically in terms of individual contact centres’ operating realities. Similar to Service Level and Abandon Rate, ASA should have a considerable degree of design flexibility, dependent on the type of services provided and the type of customers being serviced.
Virtual Queues with Call-Back Some platforms can also hold call-back customers in a ‘virtual’ inbound queue without losing their position after hanging up. Other features include sending text messages to customers confirming the number that they would prefer to be called back on, as well as allowing them to select the actual preferred time for the return call.
Increase the Ring Time. Although it may only have a small impact on improving both Abandon Rate and Service Level, it may be worth trying to increase the actual Ring Time before the inbound call is picked up by the IVR. When one considers that the average mobile phone connection rings for approximately 18 seconds before it passed through to voicemail, it is a clear indication that customers are used to and comfortable with a slightly longer up-front ring time.
For example, customers calling technical support services will be content to wait quite a lot longer to be served than those calling typical consumer lines or an emergency services number.
Just as it is critical to monitor and report on Service Level on an hour-by-hour basis (if not even more frequently) ‘averaged ASA’ can hide critical failures in service delivery. In a typical operational situation where -for example - over the lunchtime period – poor scheduling coupled with poor schedule adherence by agents and a spike in inbound call volumes, could force callers into a two- or three-minute queue time. Although this would certainly raise the average across the day by only a few points, it will probably still be within the defined SLA. Yet the negative impact on CSat, NPS and other customer metrics during the contact volume ‘spike’, could be devastating.

The most widely accepted standard for Average Speed to Answer is the same as that for Service Level, namely 20 seconds. (90% of calls answered by a ‘live’ agent in 20 seconds). This can be used as a practical baseline. But bear in mind that the type of operation (for example, Emergency Services, Inbound Sales etc. will have an influence on how you establish this KPI)
It is the case in many organisations that the call centre or contact centre is regarded by many in the higher levels of executive management (particularly amongst the ‘Old School’) to be somewhat of a reluctantly-funded cost centre; a ‘necessary evil’. Whilst this situation is starting to change for the better, we contact centre professionals have to shoulder some of the blame for this situation.
One should also take care when crafting ASA definitions and reporting models to specifically exclude abandoned calls from calculations.
We have tended to shroud much of our contact centre activities in what the ‘Old School’ may consider to be a Mumbo-Jumbo of hard-to-comprehend acronyms and piles of statistical reporting that only makes business sense to a few of the more enlightened.
As an industry we may well have been able to get away with it in the past. We applied for and were mostly provided with merely adequate budgets to keep the operation going, year-after-year. It’s now ‘Game Over’. The new game
in town in the “Battle for Budgets in the Boardroom” is quite simply, Return on Investment. Unless contact centre management can provide irrefutable evidence and credible arguments, we are not going to
be able to win the support for financial and other resources vital to drive customer service excellence. We have to start talking the language of the boardroom…
The Business Case and the organisation’s strategic intent!
Sadly, far too few contact call centres or centres actually measure and report on operational costs at a granular level. This is a shocking reality; particularly when one recognises that all five of the widely acknowledged ‘Key Challenges’ (see the opening statement of this article) or demands by the executive team on the operation refer to financial issues.
It is my position that particularly as the industry rapidly enters the omnichannel era, and as a consequence, will require significant investments in increasingly sophisticated (and expensive) technologies and enhanced human skills, it has become critical that every interaction type (and sub category) is specifically measured in terms of ‘all-in’ costs and reported on in terms of cost-per-second, per minute or per completed process.
Not only will this granular-level reporting highlight excessive costs, wastage and opportunities for cost reduction, these reporting models will allow contact centre management to present rational and highly credible ROI arguments when lobbying the executive team for financial support for new technologies, increased staffing, additional training, incentives and bonusses or any other interventions requiring funding.
Other than the more sophisticated Business Process Outsource (BPO) providers and matured telesales operators whose very existence hinges on maintaining accurate costing models, it has been my experience that most service-orientated contact centres only have a vague idea of overheads and detailed operating costs.
Best practice recommendation is for contact centre managers to engage on this subject with colleagues in the likes of the Finance and HR and any other appropriate business units, and to jointly develop a granular level costing model. This is an extremely challenging task. Many of the individual line-item costs will be ‘buried’ in the corporate financial management structures and will need the tenacity of a CSI detective to unearth the real figures. A comprehensive contact centre costing model will contain as many as 300 or 400 individual cost line-items.
Success lies in knowing, understanding and being able to correlate true operational costs with realistic customer value data, and thereafter to produce credible, financially-based reports or motivations for resourcing.
It is also vital that the true cost and the measurable value of individual customer interactions are reported along with credible projections of value-based customer satisfaction statistics, customer loyalty and revenue or profit projections.
It is widely recognised that AHT is probably the key metric (from an operational or production perspective) for all contact centre capacity planning. In a nut-shell, AHT tells us precisely the amount of time an agent is working on or committed to an identifiable task or work item. Based on this data, we have the ability to accurately plan for capacity to meet or surpass customer service expectations.
The formula for calculating AHT is as follows:

Whilst Total Hold Time will have a significant impact on AHT, care must be taken to ensure that this is measured and analysed separately (See below)
AHT is also one of the most commonly used metrics for overall contact centre operational performance as well as for agent or team performance. The fundamental problem with using AHT as a performance metric is that in many cases it forces agents to focus on speed of service rather than quality of service. Also, AHT metrics tell us nothing about call quality or call outcomes. There is a growing trend for management to closely monitor AHT but agents are measured on it in terms of CSat.
Extreme care should be taken to ensure that driving agents too hard to maintain prescribed AHT ‘norms’ can drive down the overall Customer Experience, Customer Satisfaction and Net Promotor Scores.
Astute contact centre managers will be aware of and take precautions and actions to mitigate some typical agent ‘tricks’ that can seriously skew AHT stats.
The following are examples
■ Deliberately cutting off long or complex calls as the call duration approaches the AHT target
■ Unnecessarily transferring or escalating long, difficult or complex calls
■ Rushing callers to complete the call
■ Not truly listening to caller’s problem, challenges or information requests
■ Not probing for additional customer issues after the primary issue has been successfully addressed
■ Making promises to callers that cannot be kept
■ Blaming or finding loopholes in IT
■ Avoiding or not completing after-call wrap-up processes
■ Not following up on undertakings to customers
It is critical for contact centre managers to recognise the differences between Average Talk Time and Average Handling time. Although ATT and AHT both measure the time an agent is ‘committed to an interaction’ ATT specifically excludes any hold time.
As an example: A contact centre may well consistently meet its defined Average Handling Time. On paper, it looks good. But what if ATT analytics were to show that a significant portion of the handling time was made up of agents habitually putting customers on hold? The overall Customer Experience (CSat, NPS and other metrics) would certainly suffer. This will also have a negative impact on Service Level and the accuracy of scheduling.
A deep-dive and a closer look at real ATT analytics can reveal serious flaws in processes, recruitment, training, QA, coaching, technologies and support systems.

Occupancy, in its most succinct form, is calculated as a percentage representing the actual amount of time that agents spend on call-related (or interaction-related) activities while they are logged-on and expected to be handling interactions. ‘Related Activities’ include – for example – all talk time, hold time and wrap-up time. (Or similar activities for non-voice interactions) Measuring, monitoring and managing Occupancy will provide managers with a powerful Efficiency Index. In other words, are agents fully utilised or could they be handling additional tasks or work items?

Bear in mind that Occupancy targets should be set in terms of organisational goals for continuous improvement and take cognizance of financial, staffing practices and Cx metrics and goals.
A good guideline for establishing Optimum Occupancy will be between 80% and 85%. This is probably ‘the sweet spot’ in terms of productivity, efficiency and rational manpower utilisation. Managers are cautioned against pushing for occupancy rates higher than this as it will almost certainly lead to agent burn-out, reduced Cx and higher absenteeism and attrition. The knock-on of these factors includes diminished CSat, reduced customer loyalty, declining revenues and escalating costs associated with recruitment, training and assimilating new staff.
Utilisation, on the other hand, differs from Occupancy in that it represents the amount of time that agents spend on call- (or interaction) related activities whilst they are present at work in the contact centre. Utilisation calculations therefore include all the time spent by agents on internal activities – not just their logged-in time.

Monitoring and measuring Utilisation is a critical element of overall contact centre management as it considers all non-customer-related activities that comprise a large portion of overall centre costs and overheads.
Occupancy. A good guideline for Occupancy will be between 80% and 85%. Managers are cautioned against pushing for occupancy rates higher than this as it will almost certainly lead to agent burn-out, reduced CSat and higher absenteeism and attrition.
Many industry stalwarts may disagree on the detailed composite elements or wording when it comes to defining ‘Shrinkage’, but most will agree that it is fundamentally anything that takes an agent away from their ability to handle customer interactions.
Whilst Shrinkage is an essential factor for overall planning and a critical input to medium and large-scale Workforce Planning tools and disciplines, it is not necessarily a KPI that is measured and tracked on a day-to-day basis. Shrinkage is normally expressed across a complete 12-month period but monitoring and reporting shrinkage would certainly provide management with valuable insights.
■ Sick leave / Absenteeism
■ Family Responsibility and Compassionate Leave
■ Planned / Scheduled Leave
■ Public/Statutory Holidays
■ Paid Breaks (Lunch and Tea Breaks)
■ Unscheduled Absenteeism
■ Lateness / Tardiness
■ Coaching and training sessions
■ Team meetings
It is my personal opinion that a contact centre running consistently at a 30% (or lower) shrinkage factor is either super-efficient and in the hands of a well-seasoned and experienced contact centre management team, or alternatively, it is bordering on being a sweat-shop. In this latter case there will be consequential negative impact from high attrition, low staff engagement, low CSat, NPS and other customer metrics.
In its most basic definition: Shrinkage is the reduction of the number of staff (from a theoretical level) of full-time equivalent agents (FTEs) able to be fully productive 100% of the time throughout the year.
As mentioned in the context of ‘Utilisation’ (above), there are two clear components to overall Shrinkage. These are, Internal and External Shrinkage.
■ Contact centre social activities
■ One-to-one reviews/chats
■ Toilet, smoke and other unplanned facility breaks
■Time spent helping other departments or business units
■ Special and creative projects
■ System downtime

It will be recognised that unless all Internal and External shrinkage factors are defined exactly the same way for any two or more contact centres, the overall Shrinkage Factor will differ widely. However, it is generally accepted by many specialist contact centre consultants that a global ‘Industry Standard’ for shrinkage is 30% to 35%.
That would mean that were we to use an Erlang Calculator to work out staffing requirements for any given period, and the answer was (say) 70 agents, and our known Shrinkage was (say) 30%, we would actually need more like 100 agents to maintain Service Level.
Schedule Adherence is the percentage of the agent’s scheduled working time when they are actually present in their designated working environment. This will include all of the above shrinkage factors.

The table below clearly illustrates the negative impact on Service Level (and consequential drop in CSat) when Schedule Adherence drops by even one or two agents. Conversely, over-staffing will certainly have a high cost impact with insignificant gains in actual customer satisfaction.
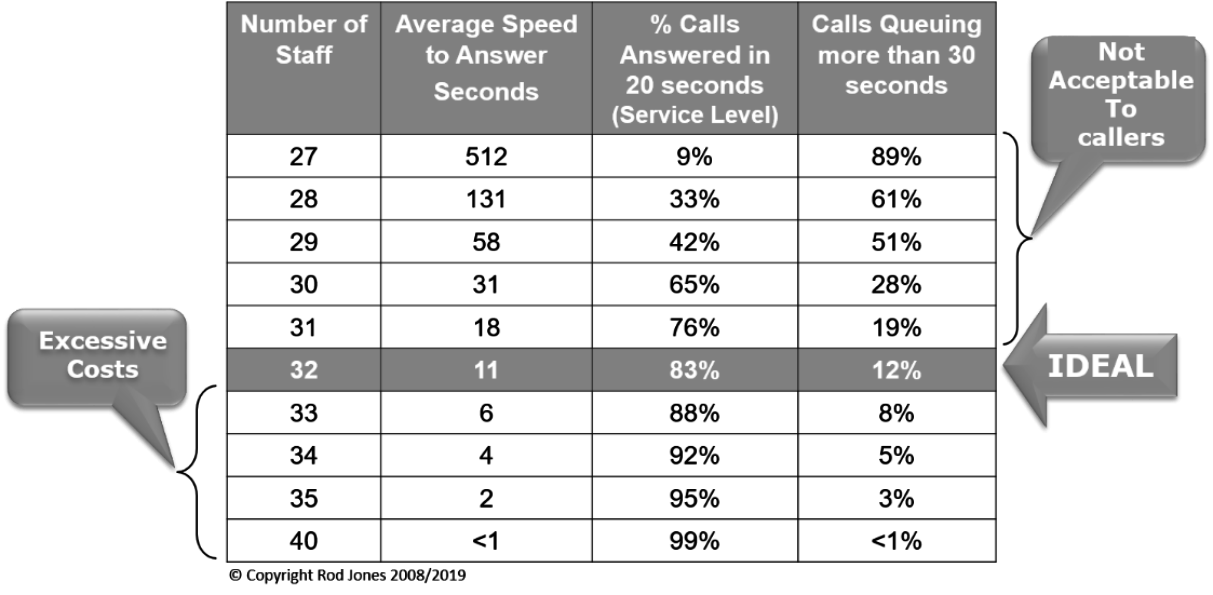
A serious negative impact of poor Schedule Adherence is the knock-on impact that this has on Occupancy. Not shown in the above table, with 32 agents, Occupancy will be in the region of 85%. When available agents are reduced to 30, Occupancy will raise dramatically to an unsustainable 95%+. This puts immense pressure on agents and symptoms of ‘burnout’ and high stress levels will start manifesting within hours.
Whilst the actual impact on operations should one or two agents be merely a few minutes late to log-in may be slight, when consistent and widespread tardiness becomes the norm, the consequences become extremely serious.
Most reputable benchmarking reports and experienced contact centre consultants agree that Schedule Adherence of between 85-95% is generally considered acceptable.
Customer Satisfaction – or CSat, is probably the most widely used and recognised measure of customer sentiment. The advantage of there being no single or universally recognised approach to CSat measurement tools or methodologies, is that the basic concept allows organisations to craft their own bespoke models to meet their specific needs.
Another concept relating to CSat is that, in fact, overall Customer Satisfaction should be monitored, measured, analysed and acted on using a combination of different data-gathering methods and approaches. These could include, basic Customer Satisfaction probes as well as Net Promotor Score (NPS) and Customer Effort Score.
In its most basic form, surveys including a question such as ..."On a scale of one to ten, how satisfied were you with our service today?" The result is a set of data that can easily be represented as a percentage.


One of the easiest and quickest ways that surveyors can use to gauge customer sentiment is the used of Happy – Neutral – Unhappy icons, typically used with a ‘tick-box’ technique. This approach can yield significantly higher response rates without the need for complex analytics. It also allows surveyors to do qualified follow-up probes with specifically identified customers.

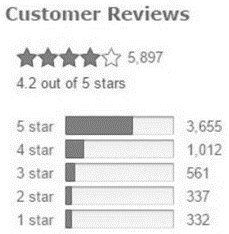
The ubiquitous Amazon Customer Review model is a perfect example of how this technique can be applied to virtually any product, service or organisation.
Originally developed in 2003 and introduced into the marketing fraternity by Fred Reicheld of Bain & Company and Satmetrix, Net Promoter or Net Promotor Score is a widely used management tool used to gauge the loyalty of an organisation’s customers.
The Net Promotor Score (NPS) is calculated based on responses to a single question:
“On a scale of 0 to 10, how likely is it that you would recommend our company (or product or service) to a friend or colleague?”Those who respond with a score of 9 or 10 are called Promotors.
These are fiercely loyal and supportive customers; the organisation’s Advocates.
Those who respond with a score of 0 to 6 are labelled Detractors. These are potentially damaging to the organisation.
Responses of 7 or 8 are referred to as Passives .

Becoming increasingly more popular and used by major organisations such as Amazon and Netflix, the Star Rating System is familiar to most customers and is easy to implement and to maintain as an integral part of the organisation’s marketing.
It is generally accepted that although heavily dependent on industry sector, an NPS score of 50 or more is either ‘really good’ or ‘excellent. It indicates that the organisation is highly customer centric. At a score of 70+ the organisation will be in the company of global brand leaders such as Apple, Amazon and Walt Disney. Achieving consistently high NPS ratings indicates that the organisation is geared for significant organic growth powered largely by customer advocacy.
In isolation, an NPS score tells us very little. However, when monitored and measured over a period of six to twelve months (or even longer), positive or negative shifts in NPS trends will be strong indicators. For example: A 10% positive shift in NPS is a powerful confirmation that the organisation is heading in the right direction; becoming increasingly more customer centric and therefore driving organic growth and consequential profitability.
It is also recommended that to drive the improvement of NPS, customer verbatims are used to identify trends in expectations and sentiments. Also implement targeted coaching for agents in the bottom percentage of NPS performers
There is certainly sufficient evidence to support the premise that high effort on the part of customers to resolve issues with their providers, leads to significantly diminished Customer Satisfaction and diminished Loyalty. High effort is one of the most powerful drivers of customer defection.
In the light of massive developments in omnichannel customer self-service, reduced or minimised customer effort is rapidly becoming a key competitive differentiator or competitive advantage. Modern society has become effort averse.
In early 2010 when measuring customer effort (particularly in the context of call centres) was first mooted, a scale of 1 to 5 was used as the measurable response to the probe question “How much effort did you personally have
to put forth to handle your request?” Responses were initially measured as follows:-
1 = Very low effort
2 = Low effort
3 = Neutral
4 = High effort
5 = Very high effort
In many customer contact centres throughout the world, CES methodologies have evolved slightly with the emphasis on the words, ‘ease’ or ‘easy’.
The scale for this method would be measured so that:
“How easy was it for you to get your issue resolved fully, on a scale of 1-7?”1 = Extremely easy
2 = Very easy
3 = Fairly easy
4 = Neither
5 = Fairly difficult
6 = Very difficult
7 = Extremely difficult
As with other tactics and techniques for measuring overall customer satisfaction, the end goal in most cases, is to achieve optimised customer experience; this resulting in increased market share, sustainable revenues and profit. CES methods should be adapted to meet specific operational requirements and thereafter, appropriately integrated into the overall organisation as a means of driving continuous improvement.
Last words…
Fully understanding the nuances of KPIs and how to customise and implement them in your particular operation, is the hallmark of an astute contact centre professional. Essentially, there are four areas that need constant focus and attention:
■ Customer Satisfaction (How well are we serving our customers?)
■ Operational Efficiency (How well is our operation performing?)
■ Business Value (How well are we supporting the business?)
■ People Management (Are we getting the best out of our people and are they happy?)

"I help Decision-Makers to make Good Decisions about CX Contact Centres"©
https://rodjones.co.za rod@rodjones.co.za